Volatility System by W. WilderVolatility System (Volatility Stops) Similarity
Most traders adjust their stops over time in the direction of the trend in order to lock in profits. Apart from moving averages, one of the most popular techniques is trailing stops using a multiple of Average True Range. There are several variations:
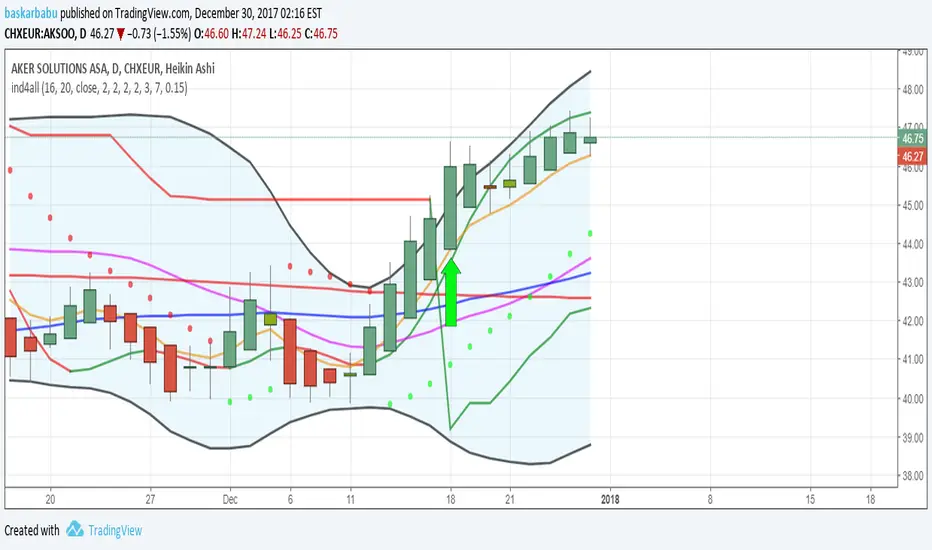
The original Volatility System(Volatility Stops), introduced by Welles Wilder in his 1978 book: New Concepts in Technical Trading Systems
Chandelier exits introduced by Alexander Elder in Come Into My Trading Room (2002) trail the stops from Highs or Lows rather than Closing Price
Average True Range Trailing Stops are similar to the above, but include a ratchet mechanism to prevent stops moving down during an up-trend or rising during a down-trend, as ATR increases
WillTrend intoduced by Larry Williams in 1988
Comparison of systems
All the systems under consideration have one common ingredient - ATR. ATR was developed by Welles Wilder and described in his book in 1978, also in this book the Volatility System was described, which in the future became known as Volatility Stops.
In fact, Wilder is the father of such systems due to the presence of ATR in the calculation of this type of indicator.
The main difference of Volatility System
Followers such as Larry Williams and Alexander Elder made minor changes to the value based on the ATR, mainly focusing on changing the base to which this value is added or subtracted.
Larry Williams uses the square root of 5 as a multiplier and calculates the ATR with a period of 66, and Alexander Elder uses a multiplier of 2.5-3.5 applying it to the ATR with a period of 22. Both authors changed the original value for ATR and multiplier calculations. Alexander Elder is closest to the original Welles Wilder calculation, which used a multiplier of 2.8.-3.1 applying it to an ATR with a period of 7.
As a reference, Elder took the Highest High(22) from which he subtracts ATR*Multiplier in an uptrend or the Lowest Low(22) to which he adds ATR*Multiplier to obtain the turning point (SAR).
Larry Williams uses the average price of extremes (Highest High(10) + Lowest Low(10)) / 2 as a reference base to which he adds or subtracts the ATR*Multilpyer values.
Both systems differ from the original, because Wilder used Significan Close(SIC) in his calculations. SIC is the maximum closing price during an uptrend and the minimum closing price during a downtrend, which
does not go beyond the current trade, as in other systems. To calculate the base when a trend changes, bars that are outside the current trend will be used when calculating WillTrend and Chandelier Exit, in contrast to the Volatility System, which takes SIC values only within the current trade. This is the main difference from subsequent developments of similar systems.
Improvements made
The original Volatility System is present as an indicator on TradingView, but it is an improved version with the addition of a ratchet and works differently from the original Weilder system.
List of improvements:
Added the ability to remove the ratchet. You need to turn off the "Trail one way" checkbox in the setting menu. When this function is turned off, the system will operate in the author-inventor mode. On some instruments, the original system works much better than the improved ratchet system, which cannot be turned off.
Added the ability to use Highest High and Lowest Low as a base instead of the closing price.
Volatility Stops Formula Description
Welles Wilder's system uses Closing Price and incorporates a stop-and-reverse feature (as with his Parabolic SAR).
Determine the initial trend direction
Calculate the Significant Close ("SIC"): the highest close reached in an up-trend or the lowest close in a down-trend
Calculate Average True Range ("ATR") for the selected period (7 days in this example)
Multiply ATR by the Multiple (3.0 in this example, best values author describes as 2.8-3.1)
The first stop is calculated in day 7 and plotted for day 8
If an up-trend, the first stop is SIC - 3 * ATR, otherwise SIC + 3 * ATR for a down-trend
Repeat each day until price closes below the stop (or above in a down-trend)
Set SIC equal to the latest Close, reverse the trend and continue.
Chandelier Exit Description
Chandelier Exits subtract a multiple of Average True Range ("ATR") from the highest high for the selected period. Using the default settings as an example:
Highest High in last 22 days - 3 * ATR for 22 days
In a down-trend the formula is reversed:
Lowest Low in last 22 days + 3 * ATR for 22 days
The time period must be long enough to capture the highest point of the recent up-trend: too short and the stops move downward; too long and the high may be taken from a previous down-trend.
It is not essential to use the same period for up and down trends; down-trends are notoriously faster than up-trends and may benefit from a shorter time period.
The multiple of 3 may be varied, but most traders settle between 2.5 and 3.5.
WillTrend Description
Larry Williams is prefer to used the Square Root from 5 as a multiplayer for ATR. SQRT(5) = 2.236
WillTrend subtract a multiple of Average True Range ("ATR") from the Middle Price (Highest High for the selected period + Lowest Low for the selected period / 2).
(Highest High in last 10 days + Lowest Low in last 10 days) / 2 - 2.236 * ATR for 66 days
In a down-trend the formula is reversed:
(Highest High in last 10 days + Lowest Low in last 10 days) / 2 + 2.236 * ATR for 66 days
Search in scripts for "parabolic SAR"

Harmonic Trend Fusion [kikfraben]📈 Harmonic Trend Fusion - Your Personal Trading Assistant
This versatile tool combines multiple indicators to provide a holistic view of market trends and potential signals.
🚀 Key Features:
Multi-Indicator Synergy: Benefit from the combined insights of Aroon, DMI, MACD, Parabolic SAR, RSI, Supertrend, and SMI Ergodic Oscillator, all in one powerful indicator.
Customizable Plot Options: Tailor your chart by choosing which signals to visualize. Whether you're interested in trendlines, histograms, or specific indicators, the choice is yours.
Color-Coded Trends: Quickly identify bullish and bearish trends with the color-coded visualizations. Stay ahead of market movements with clear and intuitive signals.
Table Display: Stay informed at a glance with the interactive table. It dynamically updates to reflect the current market sentiment, providing you with key information and trend direction.
Precision Control: Fine-tune your analysis with precision control over indicator parameters. Adjust lengths, colors, and other settings to align with your unique trading strategy.
🛠️ How to Use:
Customize Your View: Select which indicators to display and adjust plot options to suit your preferences.
Table Insights: Monitor the dynamic table for real-time updates on market sentiment and trend direction.
Indicator Parameters: Experiment with different lengths and settings to find the combination that aligns with your trading style.
Whether you're a seasoned trader or just starting, Harmonic Trend Fusion equips you with the tools you need to navigate the markets confidently. Take control of your trading journey and enhance your decision-making process with this comprehensive trading assistant.

Co-relation and St-deviation Strategy - BNB/USDT 15minThis indicator based on statistical analysis. it uses standard deviation and its co-relation to price action to generate signals. and following indicators has been used to calculate standard deviation and its co-relation values. finally it is capable to identify market changes in bottoms to pic most suitable points.
1. Parabolic SAR (parabolic stop and reverse)
2. Supertrend
3. Relative strength index (RSI)
4. Money flow index (MFI)
5. Balance of Power
6. Chande Momentum Oscillator
7. Center of Gravity (COG)
8. Directional Movement Index (DMI)
9. Stochastic
10. Symmetrically weighted moving average with fixed length
11. True strength index (TSI)
12. Williams %R
13. Accumulation/distribution index
14. Intraday Intensity Index
15. Negative Volume Index
16. Positive Volume Index
17. On Balance Volume
18. Price-Volume Trend
19. True range
20. Volume-weighted average price
21. Williams Accumulation/Distribution
22. Williams Variable Accumulation/Distribution
23. Simple Moving Average
24. Exponential Moving Average
25. CCI (commodity channel index)
26. Chop Zone
27. Ease of Movement
28. Detrended Price Oscillator
29. Advance Decline Line
30. Bull Bear Power

[JL] Cross CandlesI made Stoch candle yesterday, and want to compare other indicators.
So I code this one including 8 indicators on this version:
Stochastic Cross K and D
RSI Cross RSI and an average RSI
Moving Average Cross short and long
MACD Cross MACD and Signal
Stochastic RSI Cross K and D
DMI Cross Plus and minus
Parabolic SAR Cross close and sar
Super Trend Cross direction and 0
I personally like Stochastic, RSI and Stochastic RSI as they are less lagged.
Feel free to post suggestions about other indicators. I am happy to update it.

Jeges JigsThis is a combination of all my old indicators, with an added feature for trend lines (inspiration for this came from Wedge Maker script thanks to veryfid, I hope he doesn't mind).
This script looks for a period with increased volatility , as measured by ATR ( Average True Range ), then it looks for a high or a low in that area.
When price is above EMA (400 is default, can be changed), it looks for the highs and adds multiples of ATR to the high. Default values for multipliers are 3,9 and 27, meaning that the script will show 3xATR level above the high, 9xATR above the high and 27xATR above the high.
When price is below EMA it looks for the lows and subtracts multiples of ATR from the low.The script will show 3xATR level below the low, 9xATR below the low and 27xATR below the low.
Multipliers values can be changed as well, making it a versatile tool that shows potential levels of suppport/resistance based on the volatility .
Possible use cases:
Breakout trading, when price crosses a certain level, it may show potential profit targets for trades opened at a breakout.
Stoploss helper. Many traders use ATR for their stoplosses, 1 ATR below the swing low for long trades and 1 ATR above the swing high for short trades are common values used by many traders. In this case, the Lookback value comes handy, if we want to look maybe at a more recent value for swing high/low point.
It highlights ATR peaks, it also displays Bollinger bands of SMA400 (or Ema), breakouts for upper/lower bands.
Another thing you get is Parabolic SAR and Zigzag based on SAR.
SAR MTF levelsThis indicator displays last Parabolic SAR dot levels on most common timeframes. Default option is cross shape, but can be set as lines as well. Very easy to track visually, without continuously changing chart resolution.
SAR-adjusted extremesThis indicator shows how far (i.e. the absolute distance) of the extremes (i.e. high & low) are from the current parabolic SAR

M-SQUEEZEScript for Swing Trading. It use the following indicators:
- SQUEEZE MOMENTUM INDICATOR (LAZYBEAR)
- RSI VOLUME WEIGHTED (LAZYBEAR)
- PARABOLIC SAR
Settings for OANDA:SPX500USD at 2H

Eclub Multi IndicatorThis multi Indicator includes:
3 Moving Averages
2 Exponential Moving Averages
Bollinger Band
Ichimoku
Parabolic SAR
You can change the colors if you want. Go to setting to enable Ichimoku or SAR or disable others.
The color tolerance is by default zero which results in a very sensitive color change. You can change it to decrease the sensitivity. The value should be the last decimal of the price or the last two decimals of price etc.
If you like this indicator donate some BTC to the following address:
BTC address:
18NSD2xdJyYWoC4CSr4xg1hMk2q5cBbr8T
$ SuPeR-RePaNoCHa $ [Alerts]Script for automatic trading (Alerts). This is the second part of the previous RePanoCHa script but with Take Profit.
It Use 6 indicators + volume:
-JURIK MOVING AVERAGE
-RANGE FILTER (DONOVAN WALL)
-ADX (ORIGINAL VERSION)
-PARABOLIC SAR
-RSI + VOLUME WEIGHTED (LAZYBEAR)
-MACD
-VOLUME
To close the position you can choose between Take Profit only, Trailing Stop only or both at the same time.
Example of bot syntax: (alerts once per bar)
LONG | e=BINANCEFUTURES a=ACCOUNT s=BTCUSDT c=order | delay=1 | e=BINANCEFUTURES a=ACCOUNT s=BTCUSDT c=position b=short t=market ro=1 | delay=1 | e=BINANCEFUTURES a=ACCOUNT s=BTCUSDT b=long q=100% t=market | delay=1 | e=BINANCEFUTURES a=ACCOUNT s=BTCUSDT c=position b=long p=0.7% q=50% t=post ro=1
SHORT | e=BINANCEFUTURES a=ACCOUNT s=BTCUSDT c=order | delay=1 | e=BINANCEFUTURES a=ACCOUNT s=BTCUSDT c=position b=long t=market ro=1 | delay=1 | e=BINANCEFUTURES a=ACCOUNT s=BTCUSDT b=short q=100% t=market | delay=1 | e=BINANCEFUTURES a=ACCOUNT s=BTCUSDT c=position b=short p=-0.7% q=50% t=post ro=1
LONG TP | e=BINANCEFUTURES a=ACCOUNT s=BTCUSDT c=position q=50% t=market ro=1 (if you set the TP from entry this alert is not necessary)
SHORT TP | e=BINANCEFUTURES a=ACCOUNT s=BTCUSDT c=position q=50% t=market ro=1 (if you set the TP from entry this alert is not necessary)
LONG TS | e=BINANCEFUTURES a=ACCOUNT s=BTCUSDT c=position q=10% t=market // (alerts once per minute)
SHORT TS | e=BINANCEFUTURES a=ACCOUNT s=BTCUSDT c=position q=10% t=market // (alerts once per minute)
XLONG/STOP-LOSS | e=BINANCEFUTURES a=ACCOUNT s=BTCUSDT c=order | delay=1 | e=BINANCEFUTURES a=ACCOUNT s=BTCUSDT c=position b=long t=market ro=1
XSHORT/STOP-LOSS | e=BINANCEFUTURES a=ACCOUNT s=BTCUSDT c=order | delay=1 | e=BINANCEFUTURES a=ACCOUNT s=BTCUSDT c=position b=short t=market ro=1

Market Adaptive Stop-LossI realized that the zone changes in the stoploss remained slow, so I couldn't make enough use of the characteristics of technical indicators when opening positions.
This pushed me to keep stop-loss under the influence of a dependent variable.
This script helped me a lot (everget) :
I've redesigned the stop-loss to be affected by intersections.
Therefore, this script is also suitable for adaptive moving averages, fractional periods.
Script features:
1.You can select calculation methods created by using various technical analysis methods from the scripts' settings:
-Moving Average Convergence Divergence ( Macd )
-Stochastic Oscillator ( Stoch )
-Stochastic Relative Strength Index (StochRSI)
-Stochastic Money Flow Index (StochMFI ) (More info : )
-Know Sure Thing ( KST )
-OBV ( On Balance Volume )
-SMA ( Simple Moving Average )
-EMA ( Exponential Moving Average )
-FISHERTRANSFORM ( Fisher Transform )
-AWESOMEOSCILLATOR( Awesome Oscillator )
-PSAR ( Parabolic Stop and Reverse - Parabolic SAR )
-HULLMA( Hull Moving Average )
-VWMA ( Volume Weighted Moving Average )
-RMA (Moving Average using in Relative Strength Index calculations.)
-COG (Center of Gravity )
-ACC-DIST ( Accumulation / Distribution Index )
2 - The region is determined according to the above calculation methods and if it is larger or smaller than the previous stop loss level.
And if the price in the negative zone is lower than the stoploss, it is the exact signal and is shown with more highlighted colors.
And, in the positive zone, where the price is greater than the stoploss, the trade zones are certain.
Shown with more highlighted colors.
If the zones are correct but stop-loss is not suitable for opening positions:
In other words, if the stop-loss is above/under the highest-lowest levels in the positive zone or if the stop loss is located in the lower zone in the negative zone, these zones are shown to be darker and dimmed so that they do not cause false movements.
*** SUMMARY : As a result, you can use this script with support and resistances,and trend lines to get good results.
I hope it helps in your analyzes. Best regards.

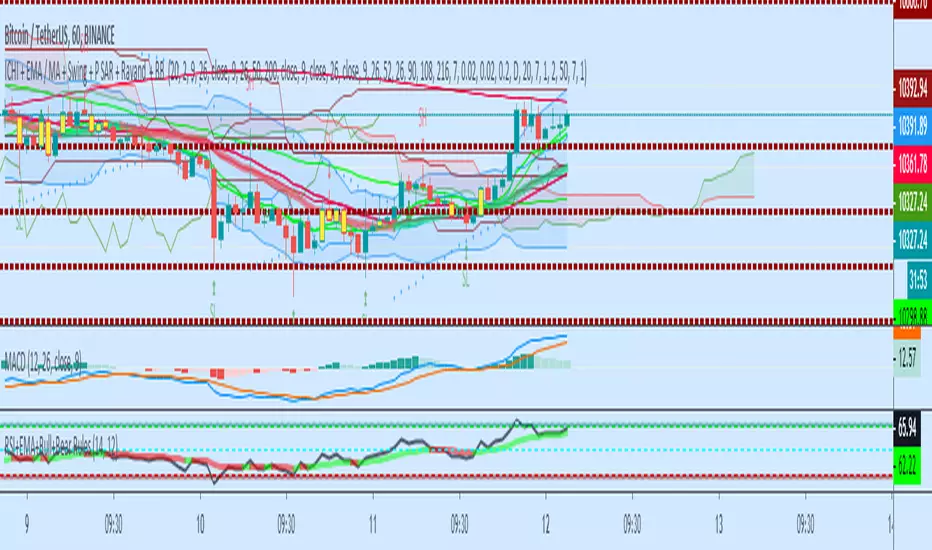
ICHI + EMA / MA + Swing + P SAR + BB A combination of Swing, Ichimuko and 3 different kijunsen, EMA, MA, MA and EMA, ( cross ), Parabolic Sar, BB, and the middle line of Bolinger Band Indicators
open source to the further adjustment

All indicators in one!All indicators in one!
Hull MA (2 colors) + Bollinger Bands + 6 EMA + 50 SMA + 200 SMA + Parabolic SAR + SUPER TREND (2 colors) + Doji signals (yellow)
Parabolic StopParbolic Stop is a mix between the indicator Parabolic SAR, Volatility Stop and an SMA.
The goal of this indicator is to place your stop loss in an optimized spot. You can also combine the indicator switch from different timeframes to get buy or sell signal.
PSAR+EMA+Hull+BBDescription
This all-in-one indicator combines four proven tools:
Parabolic SAR (Everget) — trend direction and potential reversals.
Exponential Moving Averages (20/50/100/200) — customizable lengths, colors, and offsets.
Hull Suite (InSilico) — smooth trend detection with multiple variations (HMA, THMA, EHMA).
Bollinger Bands — volatility and dynamic support/resistance.
Features
Toggle each module on/off in settings.
Fully configurable inputs (lengths, colors, offsets, multipliers).
Optional PSAR labels, highlights, and state fill.
Hull can color candles, draw band fills, and pull from higher timeframes.
Bollinger Bands include multiple basis types, stdev multipliers, and fill transparency.
Built-in alerts: PSAR direction change, Hull trending up/down.
Category
Trend Analysis (with Volatility as secondary).

🏆 AI Gold Master IndicatorsAI Gold Master Indicators - Technical Overview
Core Purpose: Advanced Pine Script indicator that analyzes 20 technical indicators simultaneously for XAUUSD (Gold) trading, generating automated buy/sell signals through a sophisticated scoring system.
Key Features
📊 Multi-Indicator Analysis
Processes 20 indicators: RSI, MACD, Bollinger Bands, EMA crossovers, Stochastic, Williams %R, CCI, ATR, Volume, ADX, Parabolic SAR, Ichimoku, MFI, ROC, Fibonacci retracements, Support/Resistance, Candlestick patterns, MA Ribbon, VWAP, Market Structure, and Cloud MA
Each indicator generates BUY (🟢), SELL (🔴), or NEUTRAL (⚪) signals
⚖️ Dual Scoring Systems
Weighted System: Each indicator has configurable weights (10-200 points, total 1000), with higher weights for critical indicators like RSI (150) and MACD (150)
Simple Count System: Basic counting of BUY vs SELL signals across all indicators
🎯 Signal Generation
Configurable thresholds for both systems (weighted score threshold: 400-600 recommended)
Dynamic risk management with ATR-based TP/SL levels
Signal strength filtering to reduce false positives
📈 Advanced Configuration
Customizable thresholds for all 20 indicators (RSI levels, Stochastic bounds, Williams %R zones, etc.)
Dynamic weight bonuses that adapt to dominant market trends
Risk management with configurable TP1/TP2 multipliers and stop losses
🎛️ Visual Interface
Real-time master table displaying all indicators, their values, weights, and current signals
Visual trading signals (triangles) with detailed labels
Optional TP/SL lines and performance statistics
💡 Optimization Features
Gold-specific parameter tuning
Trend analysis with configurable lookback periods
Volume spike detection and volatility analysis
Multi-timeframe compatibility (15m, 1H, 4H recommended)
The system combines traditional technical analysis with modern weighting algorithms to provide comprehensive market analysis specifically optimized for gold trading.
Ragazzi è una meraviglia, pronto all uso, già configurato provatelo divertitevi e fate tanti soldoni poi magari una piccola donazione spontanea sarebbe molto gradita visto il tempo, risorse e gli insulti della moglie che mi diceva che perdevo tempo, fatemi sapere se vi piace.
nel codice troverete una descrizione del funzionamento se vi vengono in mente delle idee per migliorarlo contattatemi troverete i mie contatti in tabella un saluto.

MomentumSync-PSAR: RSI·ADX Filtered 3-Tier Exit StrategyTriSAR-E3 is a precision swing trading strategy designed to capitalize on early trend reversals using a Triple Confirmation Model. It triggers entries based on an early Parabolic SAR bullish flip, supported by RSI strength and ADX trend confirmation, ensuring momentum-backed participation.
Exits are tactically managed through a 3-step staged exit after a PSAR bearish reversal is detected, allowing gradual profit booking and downside protection.
This balanced approach captures trend moves early while intelligently scaling out, making it suitable for directional traders seeking both agility and control.

Timeshifter Triple Timeframe Strategy w/ SessionsOverview
The "Enhanced Timeshifter Triple Timeframe Strategy with Session Filtering" is a sophisticated trading strategy designed for the TradingView platform. It integrates multiple technical indicators across three different timeframes and allows traders to customize their trading Sessions. This strategy is ideal for traders who wish to leverage multi-timeframe analysis and session-based trading to enhance their trading decisions.
Features
Multi-Timeframe Analysis and direction:
Higher Timeframe: Set to a daily timeframe by default, providing a broader view of market trends.
Trading Timeframe: Automatically set to the current chart timeframe, ensuring alignment with the trader's primary analysis period.
Lower Timeframe: Set to a 15-minute timeframe by default, offering a granular view for precise entry and exit points.
Indicator Selection:
RMI (Relative Momentum Index): Combines RSI and MFI to gauge market momentum.
TWAP (Time Weighted Average Price): Provides an average price over a specified period, useful for identifying trends.
TEMA (Triple Exponential Moving Average): Reduces lag and smooths price data for trend identification.
DEMA (Double Exponential Moving Average): Similar to TEMA, it reduces lag and provides a smoother trend line.
MA (Moving Average): A simple moving average for basic trend analysis.
MFI (Money Flow Index): Measures the flow of money into and out of a security, useful for identifying overbought or oversold conditions.
VWMA (Volume Weighted Moving Average): Incorporates volume data into the moving average calculation.
PSAR (Parabolic SAR): Identifies potential reversals in price movement.
Session Filtering:
London Session: Trade during the London market hours (0800-1700 GMT+1).
New York Session: Trade during the New York market hours (0800-1700 GMT-5).
Tokyo Session: Trade during the Tokyo market hours (0900-1800 GMT+9).
Users can select one or multiple sessions to align trading with specific market hours.
Trade Direction:
Long: Only long trades are permitted.
Short: Only short trades are permitted.
Both: Both long and short trades are permitted, providing flexibility based on market conditions.
ADX Confirmation:
ADX (Average Directional Index): An optional filter to confirm the strength of a trend before entering a trade.
How to Use the Script
Setup:
Add the script to your TradingView chart.
Customize the input parameters according to your trading preferences and strategy requirements.
Indicator Selection:
Choose the primary indicator you wish to use for generating trading signals from the dropdown menu.
Enable or disable the ADX confirmation based on your preference for trend strength analysis.
Session Filtering:
Select the trading sessions you wish to trade in. You can choose one or multiple Sessions based on your trading strategy and market focus.
Trade Direction:
Set your preferred trade direction (Long, Short, or Both) to align with your market outlook and risk tolerance. You can use this feature to gauge the market and understand the possible directions.
Tips for Profitable and Safe Trading:
Recommended Timeframes Combination:
LT: 1m , CT: 5m, HT: 1H
LT: 1-5m , CT: 15m, HT: 4H
LT: 5-15m , CT: 4H, HT: 1W
Backtesting:
Always backtest the strategy on historical data to understand its performance under various market conditions.
Adjust the parameters based on backtesting results to optimize the strategy for your specific trading style.
Risk Management:
Use appropriate risk management techniques, such as setting stop-loss and take-profit levels, to protect your capital.
Avoid over-leveraging and ensure that you are trading within your risk tolerance.
Market Analysis:
Combine the script with other forms of market analysis, such as fundamental analysis or market sentiment, to make well-rounded trading decisions.
Stay informed about major economic events and news that could impact market volatility and trading sessions.
Continuous Monitoring:
Regularly monitor the strategy's performance and make adjustments as necessary.
Keep an eye on the results and settings for real-time statistics and ensure that the strategy aligns with current market conditions.
Education and Practice:
Continuously educate yourself on trading strategies and market dynamics.
Practice using the strategy in a demo account before applying it to live trading to gain confidence and understanding.

Kernel Regression Bands SuiteMulti-Kernel Regression Bands
A versatile indicator that applies kernel regression smoothing to price data, then dynamically calculates upper and lower bands using a wide variety of deviation methods. This tool is designed to help traders identify trend direction, volatility, and potential reversal zones with customizable visual styles.
Key Features
Multiple Kernel Types: Choose from 17+ kernel regression styles (Gaussian, Laplace, Epanechnikov, etc.) for smoothing.
Flexible Band Calculation: Select from 12+ deviation types including Standard Deviation, Mean/Median Absolute Deviation, Exponential, True Range, Hull, Parabolic SAR, Quantile, and more.
Adaptive Bands: Bands are calculated around the kernel regression line, with a user-defined multiplier.
Signal Logic: Trend state is determined by crossovers/crossunders of price and bands, coloring the regression line and band fills accordingly.
Custom Color Modes: Six unique color palettes for visual clarity and personal preference.
Highly Customizable Inputs: Adjust kernel type, lookback, deviation method, band source, and more.
How to Use
Trend Identification: The regression line changes color based on the detected trend (up/down)
Volatility Zones: Bands expand/contract with volatility, helping spot breakouts or mean-reversion opportunities.
Visual Styling: Use color modes to match your chart theme or highlight specific market states.
Credits:
Kernel regression logic adapted from:
ChartPrime | Multi-Kernel-Regression-ChartPrime (Link in the script)
Disclaimer
This script is for educational and informational purposes only. Not financial advice. Use at your own risk.

Ultimate MA & PSAR [TARUN]Overview
This indicator combines a customizable Moving Average (MA) and Parabolic SAR (PSAR) to generate precise long and short trade signals. A dashboard displays real-time trade conditions, including signal direction, entry price, stop loss, and PnL tracking.
Key Features
✅ Customizable MA Type & Period – Choose between SMA or EMA with adjustable length.
✅ Adaptive PSAR Settings – Modify start, increment, and max step values to fine-tune stop levels.
✅ Trade Signal Logic – Identifies potential buy (long) and sell (short) opportunities based on:
Price action relative to MA
MA trend direction (rising or falling)
PSAR confirmation
✅ Dynamic Stop Loss Calculation – Uses lowest low/highest high over a specified period for stop loss placement.
✅ Trade State & Reversal Handling – Manages active trades, pending signals, and stop loss exits dynamically.
✅ PnL & Dashboard Table – Displays real-time signal status, entry price, stop loss, and profit/loss (PnL) in an easy-to-read format.
How It Works
1.Buy (Long) Condition:
MA is rising
Price is above the MA
PSAR is below price
2.Sell (Short) Condition:
MA is falling
Price is below the MA
PSAR is above price
3.Stop Loss Handling:
For long trades → stop loss is set at the lowest low of the last X candles
For short trades → stop loss is set at the highest high of the last X candles
4.Trade Execution & PnL Calculation:
If a valid long/short setup is detected, a pending signal is placed.
On the next bullish (for long) or bearish (for short) candle, the trade is confirmed.
Real-time PnL updates help track trade performance.
Customization Options
🔹 Moving Average: SMA or EMA, adjustable period
🔹 PSAR Settings: Start, Increment, Maximum step values
🔹 Stop Loss Lookback: Choose how many candles to consider for stop loss placement
🔹 Dashboard Positioning: Select preferred display location (top/bottom, left/right)
🔹 Trade Signal Selection: Enable/Disable Long and Short signals individually
How to Use
Add the indicator to your chart.
Customize the MA & PSAR settings according to your trading strategy.
Follow the dashboard signals for trade setups.
Use stop loss levels to manage risk effectively.
Disclaimer
⚠️ This indicator is for educational purposes only and does not constitute financial advice. Always perform proper risk management and backtesting before using it in live trading.

Combined EMA Technical AnalysisThis script is written in Pine Script (version 5) for TradingView and creates a comprehensive technical analysis indicator called "Combined EMA Technical Analysis." It overlays multiple technical indicators on a price chart, including Exponential Moving Averages (EMAs), VWAP, MACD, PSAR, RSI, Bollinger Bands, ADX, and external data from the S&P 500 (SPX) and VIX indices. The script also provides visual cues through colors, shapes, and a customizable table to help traders interpret market conditions.
Here’s a breakdown of the script:
---
### **1. Purpose**
- The script combines several popular technical indicators to analyze price trends, momentum, volatility, and market sentiment.
- It uses color coding (green for bullish, red for bearish, gray/white for neutral) and a table to display key information.
---
### **2. Custom Colors**
- Defines custom RGB colors for bullish (`customGreen`), bearish (`customRed`), and neutral (`neutralGray`) signals to enhance visual clarity.
---
### **3. User Inputs**
- **EMA Colors**: Users can customize the colors of five EMAs (8, 20, 9, 21, 50 periods).
- **MACD Settings**: Adjustable short length (12), long length (26), and signal length (9).
- **RSI Settings**: Adjustable length (14).
- **Bollinger Bands Settings**: Length (20), multiplier (2), and proximity threshold (0.1% of band width).
- **ADX Settings**: Adjustable length (14).
- **Table Settings**: Position (e.g., "Bottom Right") and text size (e.g., "Small").
---
### **4. Indicator Calculations**
#### **Exponential Moving Averages (EMAs)**
- Calculates five EMAs: 8, 20, 9, 21, and 50 periods based on the closing price.
- Used to identify short-term and long-term trends.
#### **Volume Weighted Average Price (VWAP)**
- Resets daily and calculates the average price weighted by volume.
- Color-coded: green if price > VWAP (bullish), red if price < VWAP (bearish), white if neutral.
#### **MACD (Moving Average Convergence Divergence)**
- Uses short (12) and long (26) EMAs to compute the MACD line, with a 9-period signal line.
- Displays "Bullish" (green) if MACD > signal, "Bearish" (red) if MACD < signal.
#### **Parabolic SAR (PSAR)**
- Calculated with acceleration factors (start: 0.02, increment: 0.02, max: 0.2).
- Indicates trend direction: green if price > PSAR (bullish), red if price < PSAR (bearish).
#### **Relative Strength Index (RSI)**
- Measures momentum over 14 periods.
- Highlighted in green if > 70 (overbought), red if < 30 (oversold), white otherwise.
#### **Bollinger Bands (BB)**
- Uses a 20-period SMA with a 2-standard-deviation multiplier.
- Color-coded based on price position:
- Green: Above upper band or close to it.
- Red: Below lower band or close to it.
- Gray: Neutral (within bands).
#### **Average Directional Index (ADX)**
- Manually calculates ADX to measure trend strength:
- Strong trend: ADX > 25.
- Very strong trend: ADX > 50.
- Direction: Bullish if +DI > -DI, bearish if -DI > +DI.
#### **EMA Crosses**
- Detects bullish (crossover) and bearish (crossunder) events for:
- EMA 9 vs. EMA 21.
- EMA 8 vs. EMA 20.
- Visualized with green (bullish) or red (bearish) circles.
#### **SPX and VIX Data**
- Fetches daily closing prices for the S&P 500 (SPX) and VIX (volatility index).
- SPX trend: Bullish if EMA 9 > EMA 21, bearish if EMA 9 < EMA 21.
- VIX levels: High (> 25, fear), Low (< 15, stability).
- VIX color: Green if SPX bullish and VIX low, red if SPX bearish and VIX high, white otherwise.
---
### **5. Visual Outputs**
#### **Plots**
- EMAs, VWAP, and PSAR are plotted on the chart with their respective colors.
- EMA crosses are marked with circles (green for bullish, red for bearish).
#### **Table**
- Displays a summary of indicators in a customizable position and size.
- Indicators shown (if enabled):
- EMA 8/20, 9/21, 50: Green dot if bullish, red if bearish.
- VWAP: Green if price > VWAP, red if price < VWAP.
- MACD: Green if bullish, red if bearish.
- MACD Zero: Green if MACD > 0, red if MACD < 0.
- PSAR: Green if price > PSAR, red if price < PSAR.
- ADX: Arrows for very strong trends (↑/↓), dots for weaker trends, colored by direction.
- Bollinger Bands: Arrows (↑/↓) or dots based on price position.
- RSI: Numeric value, colored by overbought/oversold levels.
- VIX: Numeric value, colored based on SPX trend and VIX level.
---
### **6. Alerts**
- Triggers alerts for EMA 8/20 crosses:
- Bullish: "EMA 8/20 Bullish Cross on Candle Close!"
- Bearish: "EMA 8/20 Bearish Cross on Candle Close!"
---
### **7. Key Features**
- **Flexibility**: Users can toggle indicators on/off in the table and adjust parameters.
- **Visual Clarity**: Consistent use of green (bullish), red (bearish), and neutral colors.
- **Comprehensive**: Combines trend, momentum, volatility, and market sentiment indicators.
---
### **How to Use**
1. Add the script to TradingView.
2. Customize inputs (colors, lengths, table position) as needed.
3. Interpret the chart and table:
- Green signals suggest bullish conditions.
- Red signals suggest bearish conditions.
- Neutral signals indicate indecision or consolidation.
4. Set up alerts for EMA crosses to catch trend changes.
This script is ideal for traders who want a multi-indicator dashboard to monitor price action and market conditions efficiently.

Multi-indicator Signal Builder [Skyrexio]Overview
Multi-Indicator Signal Builder is a versatile, all-in-one script designed to streamline your trading workflow by combining multiple popular technical indicators under a single roof. It features a single-entry, single-exit logic, intrabar stop-loss/take-profit handling, an optional time filter, a visually accessible condition table, and a built-in statistics label. Traders can choose any combination of 12+ indicators (RSI, Ultimate Oscillator, Bollinger %B, Moving Averages, ADX, Stochastic, MACD, PSAR, MFI, CCI, Heikin Ashi, and a “TV Screener” placeholder) to form entry or exit conditions. This script aims to simplify strategy creation and analysis, making it a powerful toolkit for technical traders.
Indicators Overview
1. RSI (Relative Strength Index)
Measures recent price changes to evaluate overbought or oversold conditions on a 0–100 scale.
2. Ultimate Oscillator (UO)
Uses weighted averages of three different timeframes, aiming to confirm price momentum while avoiding false divergences.
3. Bollinger %B
Expresses price relative to Bollinger Bands, indicating whether price is near the upper band (overbought) or lower band (oversold).
4. Moving Average (MA)
Smooths price data over a specified period. The script supports both SMA and EMA to help identify trend direction and potential crossovers.
5. ADX (Average Directional Index)
Gauges the strength of a trend (0–100). Higher ADX signals stronger momentum, while lower ADX indicates a weaker trend.
6. Stochastic
Compares a closing price to a price range over a given period to identify momentum shifts and potential reversals.
7. MACD (Moving Average Convergence/Divergence)
Tracks the difference between two EMAs plus a signal line, commonly used to spot momentum flips through crossovers.
8. PSAR (Parabolic SAR)
Plots a trailing stop-and-reverse dot that moves with the trend. Often used to signal potential reversals when price crosses PSAR.
9. MFI (Money Flow Index)
Similar to RSI but incorporates volume data. A reading above 80 can suggest overbought conditions, while below 20 may indicate oversold.
10. CCI (Commodity Channel Index)
Identifies cyclical trends or overbought/oversold levels by comparing current price to an average price over a set timeframe.
11. Heikin Ashi
A type of candlestick charting that filters out market noise. The script uses a streak-based approach (multiple consecutive bullish or bearish bars) to gauge mini-trends.
12. TV Screener
A placeholder condition designed to integrate external buy/sell logic (like a TradingView “Buy” or “Sell” rating). Users can override or reference external signals if desired.
Unique Features
1. Multi-Indicator Entry and Exit
You can selectively enable any subset of 12+ classic indicators, each with customizable parameters and conditions. A position opens only if all enabled entry conditions are met, and it closes only when all enabled exit conditions are satisfied, helping reduce false triggers.
2. Single-Entry / Single-Exit with Intrabar SL/TP
The script supports a single position at a time. Once a position is open, it monitors intrabar to see if the price hits your stop-loss or take-profit levels before the bar closes, making results more realistic for fast-moving markets.
3. Time Window Filter
Users may specify a start/end date range during which trades are allowed, making it convenient to focus on specific market cycles for backtesting or live trading.
4. Condition Table and Statistics
A table at the bottom of the chart lists all active entry/exit indicators. Upon each closed trade, an integrated statistics label displays net profit, total trades, win/loss count, average and median PnL, etc.
5. Seamless Alerts and Automation
Configure alerts in TradingView using “Any alert() function call.”
The script sends JSON alert messages you can route to your own webhook.
The indicator can be integrated with Skyrexio alert bots to automate execution on major cryptocurrency exchanges
6. Optional MA/PSAR Plots
For added visual clarity, optionally plot the chosen moving averages or PSAR on the chart to confirm signals without stacking multiple indicators.
Methodology
1. Multi-Indicator Entry Logic
When multiple entry indicators are enabled (e.g., RSI + Stochastic + MACD), the script requires all signals to align before generating an entry. Each indicator can be set for crossovers, crossunders, thresholds (above/below), etc. This “AND” logic aims to filter out low-confidence triggers.
2. Single-Entry Intrabar SL/TP
One Position At a Time: Once an entry signal triggers, a trade opens at the bar’s close.
Intrabar Checks: Stop-loss and take-profit levels (if enabled) are monitored on every tick. If either is reached, the position closes immediately, without waiting for the bar to end.
3. Exit Logic
All Conditions Must Agree: If the trade is still open (SL/TP not triggered), then all enabled exit indicators must confirm a closure before the script exits on the bar’s close.
4. Time Filter
Optional Trading Window: You can activate a date/time range to constrain entries and exits strictly to that interval.
Justification of Methodology
Indicator Confluence: Combining multiple tools (RSI, MACD, etc.) can reduce noise and false signals.
Intrabar SL/TP: Capturing real-time spikes or dips provides a more precise reflection of typical live trading scenarios.
Single-Entry Model: Straightforward for both manual and automated tracking (especially important in bridging to bots).
Custom Date Range: Helps refine backtesting for specific market conditions or to avoid known irregular data periods.
How to Use
1. Add the Script to Your Chart
In TradingView, open Indicators , search for “Multi-indicator Signal Builder”.
Click to add it to your chart.
2. Configure Inputs
Time Filter: Set a start and end date for trades.
Alerts Messages: Input any JSON or text payload needed by your external service or bot.
Entry Conditions: Enable and configure any indicators (e.g., RSI, MACD) for a confluence-based entry.
Close Conditions: Enable exit indicators, along with optional SL (negative %) and TP (positive %) levels.
3. Set Up Alerts
In TradingView, select “Create Alert” → Condition = “Any alert() function call” → choose this script.
Entry Alert: Triggers on the script’s entry signal.
Close Alert: Triggers on the script’s close signal (or if SL/TP is hit).
Skyrexio Alert Bots: You can route these alerts via webhook to Skyrexio alert bots to automate order execution on major crypto exchanges (or any other supported broker).
4. Visual Reference
A condition table at the bottom summarizes active signals.
Statistics Label updates automatically as trades are closed, showing PnL stats and distribution metrics.
Backtesting Guidelines
Symbol/Timeframe: Works on multiple assets and timeframes; always do thorough testing.
Realistic Costs: Adjust commissions and potential slippage to match typical exchange conditions.
Risk Management: If using the built-in stop-loss/take-profit, set percentages that reflect your personal risk tolerance.
Longer Test Horizons: Verify performance across diverse market cycles to gauge reliability.
Example of statistic calculation
Test Period: 2023-01-01 to 2025-12-31
Initial Capital: $1,000
Commission: 0.1%, Slippage ~5 ticks
Trade Count: 468 (varies by strategy conditions)
Win rate: 76% (varies by strategy conditions)
Net Profit: +96.17% (varies by strategy conditions)
Disclaimer
This indicator is provided strictly for informational and educational purposes .
It does not constitute financial or trading advice.
Past performance never guarantees future results.
Always test thoroughly in demo environments before using real capital.
Enjoy exploring the Multi-Indicator Signal Builder! Experiment with different indicator combinations and adjust parameters to align with your trading preferences, whether you trade manually or link your alerts to external automation services. Happy trading and stay safe!
